

Ethereum (ETH) Price: Technical Patterns Suggest Repeat of 2021 Breakout Cycle
TLDR
- Ethereum’s price pattern mirrors its 2021 breakout setup with dead-cat bounce and final retest
- An inverse head-and-shoulders pattern on the weekly chart supports a bullish reversal
- US spot Ethereum ETFs absorbed over 286,000 ETH in a single week
- Technical signals align with growing institutional demand, unlike the retail-led 2021 cycle
- Charts and ETF inflows position ETH for a potential climb toward the $10,000 target
Ethereum’s price action is entering a critical phase as multiple technical indicators align with increasing institutional interest. Market analysts have identified price patterns that closely resemble Ethereum’s historic breakout in 2021, sparking renewed optimism. With spot ETFs accumulating substantial ETH holdings and technical charts forming bullish patterns, many experts now believe Ethereum could be preparing for a major price movement.
Current price patterns show remarkable similarities to ETH’s previous bull cycle. Analyst Merlijn The Trader has pointed out that Ethereum is following a familiar structure: a dead-cat bounce followed by months of consolidation and a final retest. This exact pattern preceded Ethereum’s massive surge from $200 to $4,000 during the last bull market.
ETHEREUM JUST COMPLETED THE 2021 SETUP.
Same dead cat. Same retest. Same ignition.
But this time Wall Street is inside the trade.The setup that ran $200 to $4,000 is live again.
Now? $10,000 $ETH isn’t a fantasy. It’s math. pic.twitter.com/1iBWNmyEGb
— Merlijn The Trader (@MerlijnTrader) September 1, 2025
The current setup appears nearly identical, with the retest forming around the $2,000 mark. This parallel strengthens the case that Ethereum may be preparing for another exponential climb.
Technical Analysis Shows Bullish Pattern
On the weekly chart, Ethereum is forming an inverse head-and-shoulders pattern, which is typically seen as a bullish reversal signal. The left shoulder sits near $2,200, the head dipped to approximately $1,500, and the right shoulder has now lifted above $3,500.
The $4,943 level remains the key resistance barrier that ETH must break to confirm this bullish outlook. The Stoch RSI signal shows weak overbought conditions as it slips below the signal line, suggesting a possible short-term cooling period.
This technical setup could open the door to a retest of the $4,100 level before stronger demand pushes prices higher. A successful breakout would finally move Ethereum out of its consolidation phase that has persisted since 2021.
Institutional Demand Through ETFs
Unlike the 2021 cycle which was primarily driven by retail investors, the current market environment shows strong institutional participation. US spot Ethereum ETFs have absorbed more than 286,000 ETH in just one week, one of the largest inflow totals since their launch.
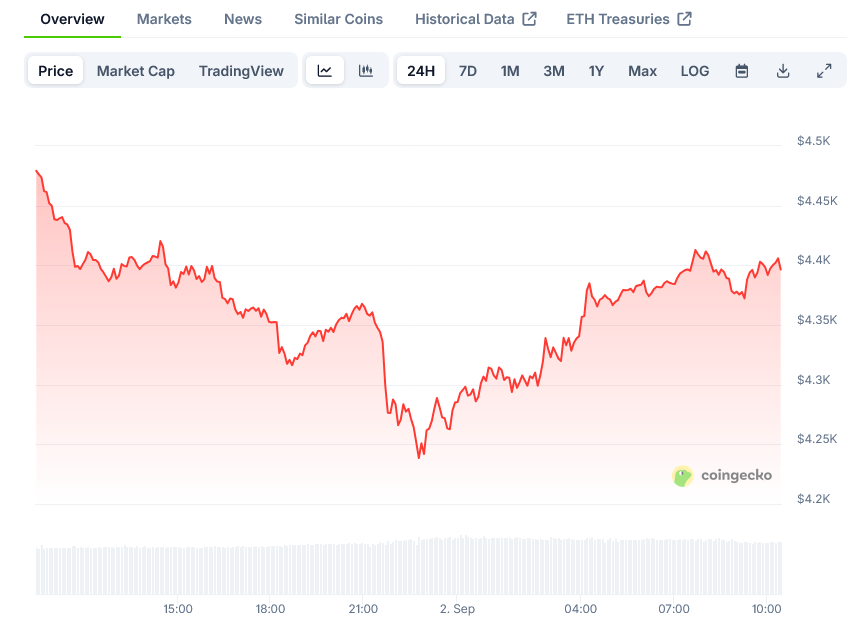
Even with ETH trading near $4,400, institutional demand has remained steady. Glassnode analytics highlights consistent inflows, reinforcing the existence of strong demand at these price levels.
These ETF inflows are creating a resilient market structure. As institutions continue to accumulate ETH, exchange supply diminishes, making sharp sell-offs more difficult to sustain.
The combination of institutional buying pressure and reduced available supply adds further momentum to Ethereum’s bullish trajectory. As long as ETF inflows continue, Ethereum price has additional support for a potential breakout toward the $10,000 target.
This institutional demand layer represents a fundamental shift from previous market cycles. The steady accumulation through regulated ETF products provides a more stable foundation for price growth compared to the volatile retail-driven speculation of past cycles.
ETH’s price action in recent weeks shows increased stability despite market fluctuations. The support at the $4,100 level has held during several retests, indicating strong buying interest at this price point.
With technical patterns mirroring previous breakout phases and institutions steadily accumulating, many analysts now view the $10,000 price target as increasingly realistic for Ethereum.
The most recent data shows continued ETF inflows and favorable technical indicators pointing toward further price appreciation as Ethereum approaches its key resistance levels.
The post Ethereum (ETH) Price: Technical Patterns Suggest Repeat of 2021 Breakout Cycle appeared first on Blockonomi.
