Bitcoin Price Prediction for Today, May 21: BTC Is Indecisive at $30,000

Bitcoin Price Prediction – May 21
Lt of concurrent trading activities has been going on in the BTC/USD market operations around the $30,000 line as the crypto-economic price is indecisive at the value line. There is a minute positive percentage rate of 0.23 on the crypto economy deals as its valuation is currently trading in the values of $29,566 and $28,955.
Bitcoin (BTC) Stastics:
BTC price now – $29,348.17
BTC market cap – $558.8 billion
BTC circulating supply – 19 million
BTC total supply – 19 million
Coinmarketcap ranking – #1
BTC/USD Market
Key Levels:
Resistance levels: $32,500, $35,000, $37,500
Support levels: $27,500, $25,000, $22,500
BTC/USD – Daily Chart
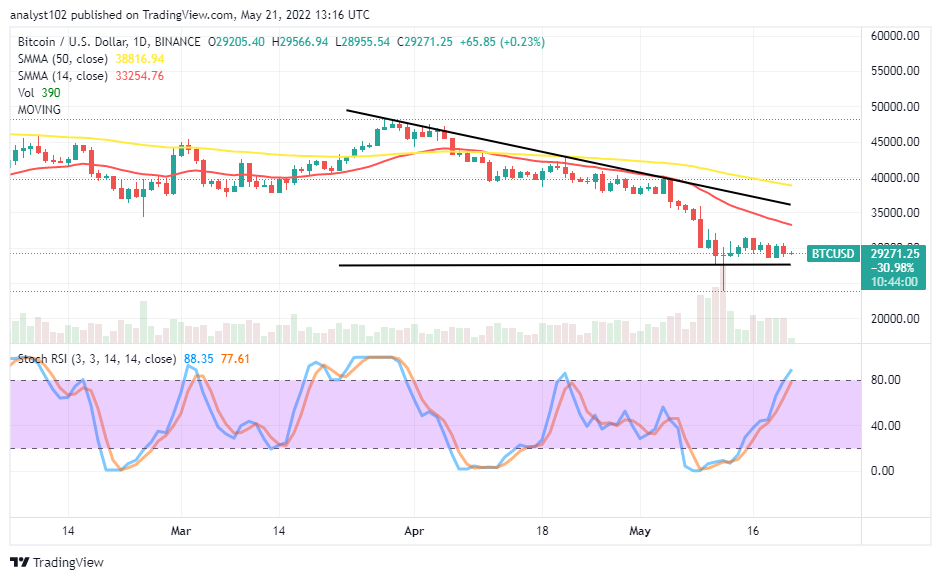
The daily chart reveals the BTC/USD market price is indecisive around the $30,000 value line over some sessions. Differential lengths of trading Japanese candlesticks have formed around the level in a range-bound format in the long-term trading outlook. The 14-day SMA indicator remains beneath the 50-day SMA indicator. The Stochastic Oscillators are on the move northbound, passing through variant range lines briefly into the overbought region.
Will the BTC/USD market run in a definite direction soon away from the $30,000?
As of writing, there has been no correlating agreement between the daily and the 4-hour charts to deduce a definite direction for the BTC/USD market operations as the crypto-economic price is indecisive around the $30,000 level presently. The Stochastic Oscillators have moved to the upside into the overbought region to denote some upward momentums are on the verge of losing stances soon to bears if buyers do not heighten efforts to shoot up fearfully away from the point mentioned in the near active operations.
On the downside of the technical analysis, the most near reliable psychological resistance trading area is the $32,500. The reaction of price around that point line has to be that the market will spring upward for a touch or a reversal with a forceful motion to get a clearer-decent sell entry order in the course of that assumption forthcoming. A sudden breakdown devoid of a quick rebound around the $27,500 support level will allow some losses to surface in the following days. But, sellers needed to be wary of a bounce-off from or around a lower-trading support spot afterward.
BTC/USD 4-hour Chart
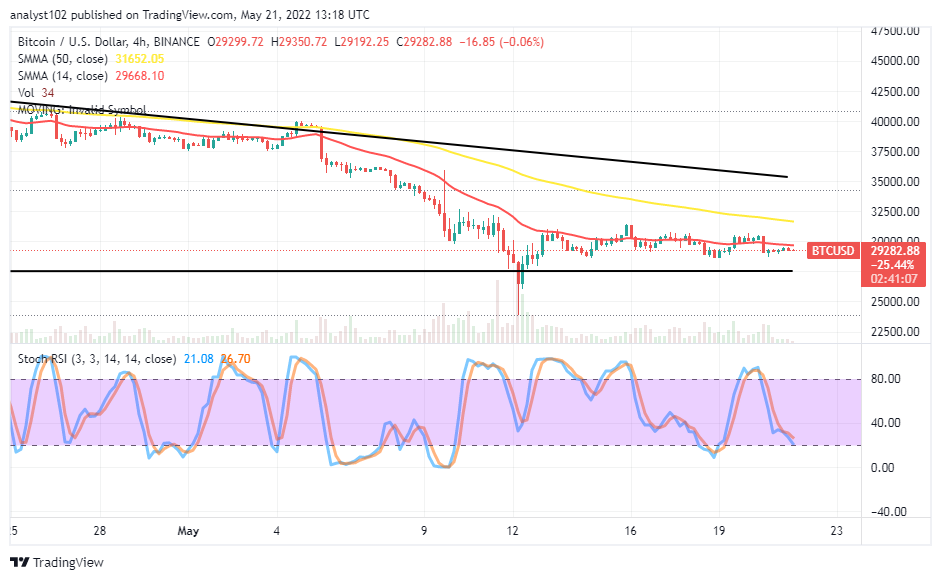
The medium-term chart showcases the BTC/USD market price is indecisive at $30,000 over a couple of trading sessions. The SMAs are in a trading outlook that looks more of being in a descending triangular pattern. The 14-day SMA indicator is beneath the 50-day SMA indicator. The Stochastic Oscillators have moved southbound. And they are still briefly pointing toward the south side near above the range of 20. If the price goes down heavily depressive, the $27,500 will emerge as one of the higher resistance levels in the near time.
Looking to buy or trade Bitcoin (BTC) now? Invest at eToro!
68% of retail investor accounts lose money when trading CFDs with this provider.
Read more:


