

Bitcoin Price Prediction for Today, May 21: BTC Could Reach $28,000 Level; Dips Likely to be Limited
After touching the daily high of $29,613, the Bitcoin price prediction shows that BTC could begin a downside correction.
Bitcoin Prediction Statistics Data:
- Bitcoin price now – $29,444
- Bitcoin market cap – $561.3 billion
- Bitcoin circulating supply – 19.0 million
- Bitcoin total supply – 19.0 million
- Bitcoin Coinmarketcap ranking – #1
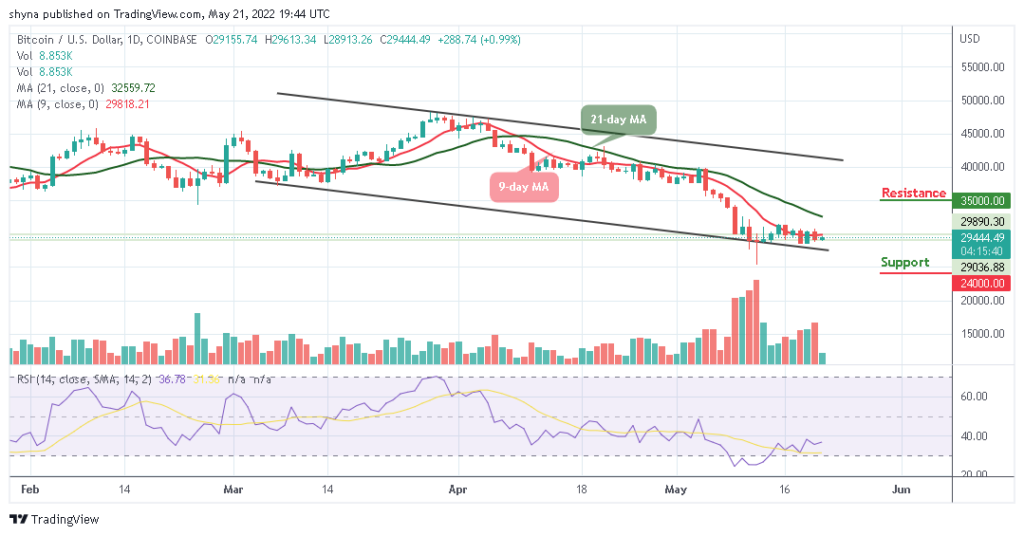
BTC/USD Long-term Trend: Bearish (Daily Chart)
Key levels:
Resistance Levels: $35,000, $37,000, $39,000
Support Levels: $24,000, $22,000, $20,000
BTC/USD is slipping below the $29,500 level as buying pressure cooled off. The market price is hovering around $29,444 to form a low at near $29,000 before stabilizing. As of now, BTC/USD is yet to cross above the 9-day moving average but it is up by 0.99%.
Bitcoin Price Prediction: What to Expect from Bitcoin (BTC)
The Bitcoin price prediction is presently at the downside. A decisive breakout below $29,000 support may intensify selling pressure. Therefore, if bears push the market price downwards, the consolidation may turn into a bear run. More so, the current sideways movement is likely to continue in the next few days, but the next hurdle for the king coin could emerge at $32,000, but it won’t stop the higher price movements.
However, the technical indicator Relative Strength Index (14) is below the 40-level, a reversal is possible but only if the resistance at $30,000 is reclaimed. The persistence trade above this level may technically push the coin to the resistance levels of $35,000, $37,000, and $39,000 while the supports lie at $24,000, $22,000, and $20,000.
BTC/USD Medium-Term Trend: Ranging (4H Chart)
Looking at the 4-Hour chart, Bitcoin (BTC) has not yet slipped below $29,000 but is in the loop of making a bounce back. The Bitcoin price hovers within the 9-day moving average and may likely take time to trade above the $32,000. At the moment, the Bitcoin price is currently moving around the $29,454 level.
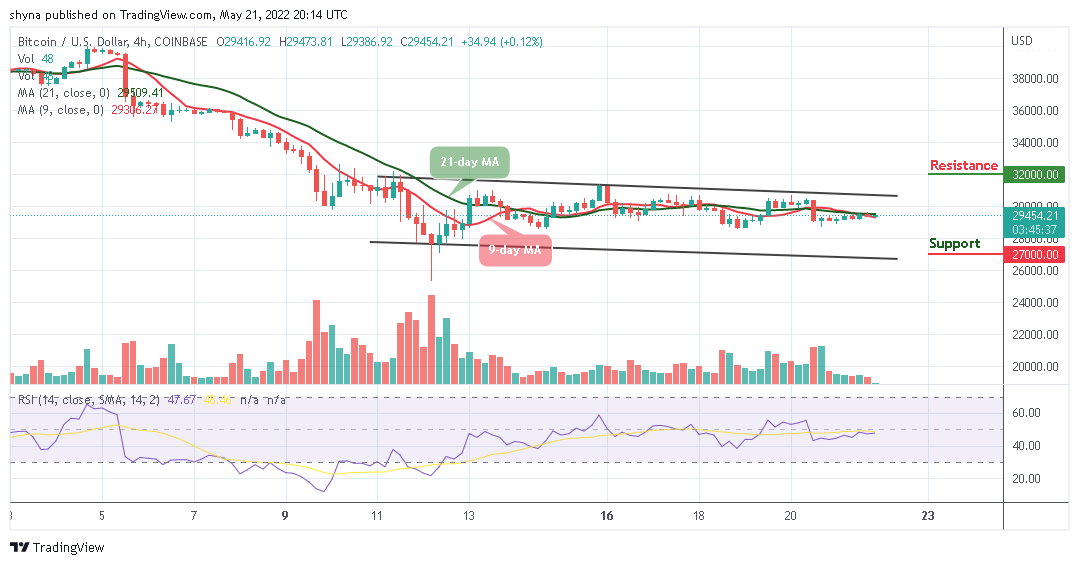
However, if the bulls energize the market, the price may likely test the resistance levels of $30,000 and above. In other words, if the bears should hold the price, and drag it downward, then the support levels of $27,000 and below may be visited as the Relative Strength Index (14) moves below the 50-level, indicating additional bearish movement.
Looking to buy or trade Bitcoin (BTC) now? Invest at eToro!
68% of retail investor accounts lose money when trading CFDs with this provider
Read more: