

Bitcoin Price Prediction for Today, June 4: BTC Moves to Cross Above $30,000
The Bitcoin price prediction reveals that BTC may break out of the current short-term pattern and move towards the $32,000 level.
Bitcoin Prediction Statistics Data:
- Bitcoin price now – $29,720
- Bitcoin market cap – $567.5 billion
- Bitcoin circulating supply – 19.0 million
- Bitcoin total supply – 19.0 million
- Bitcoin Coinmarketcap ranking – #1
BTC/USD Long-term Trend: Bearish (Daily Chart)
Key levels:
Resistance Levels: $35,000, $37,000, $39,000
Support Levels: $25,000, $23,000, $21,000
BTC/USD is at the moment trading at $29,720 with a 0.17% gain since the beginning of today’s trading. Looking at the daily chart, the Bitcoin price could struggle to stay above the 9-day and 21-day moving averages. More so, for BTC/USD to remain above this barrier, it could make many traders feel that the $29,000 support level could be pretty strong.
Bitcoin Price Prediction: Would BTC Price Break Higher
The Bitcoin price could not drop much the cause of today’s trading, but if the first digital coin breaks below the support level of $29,000, it could change the direction of the coin to face the lower boundary of the channel. Alternatively, Bitcoin (BTC) may reclaim the previous resistance level of $32,000 to head to the upside. If successful, BTC/USD could aim at the resistance levels of $35,000, $37,000, and $39,000 respectively.
Nevertheless, the technical indicator Relative Strength Index (14) is moving below 50-level as the coin may consolidate around this level. Moreover, this could mean that there may still be a room that could be explored by the bears if it crosses below 40-level. Therefore, the support levels of $25,000, $23,000, and $21,000 may play out.
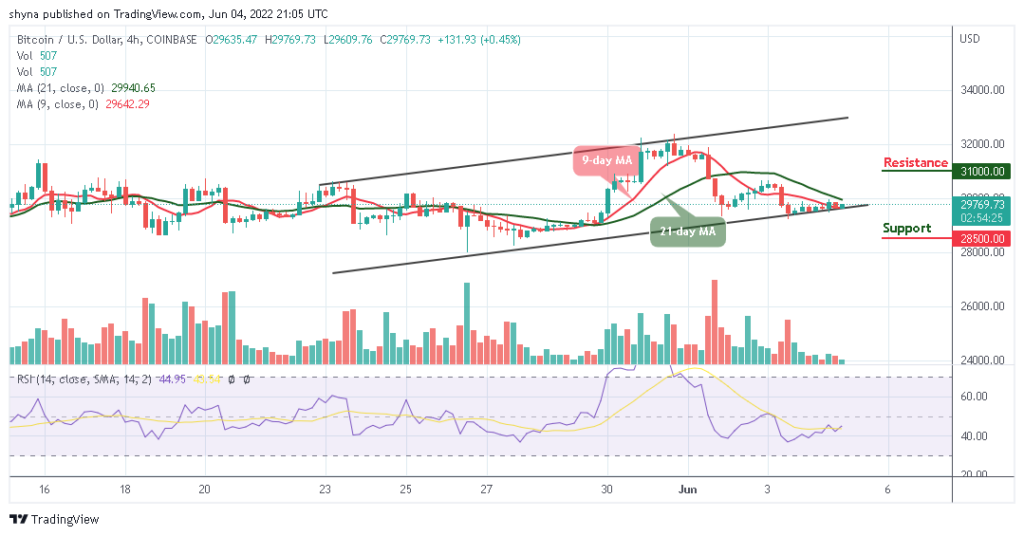
BTC/USD Medium-Term Trend: Ranging (4H Chart)
From a technical point of view, on the 4-hour chart, the technical indicator Relative Strength Index (14) is now recovering towards the 50-level, and this may confirm the bullish movement if it crosses above it. Meanwhile, adding to the above, there is a little bit of bullish divergence on the RSI (14) as the coin crosses above the 9-day moving average to continue the bullish movement.
However, if the Bitcoin price breaks below the lower boundary of the channel, the market price may likely reach support at $28,500 and below. Meanwhile, if the current market value rises and crosses above the 21-day moving average, it may reach the resistance level at $31,000 and above.
Try Bitcoin Profit, the most popular auto trader in 2020!

- 92% Claimed win-rate
- $/£ 250 Min Deposit
- Accepts Debit and Credit Card
Read more: