

Bitcoin Price Prediction for Today, July 7: BTC Bounces Above $20,000 Level
The Bitcoin price prediction gains 0.31% as bulls keep working hard to nurture a bullish trend towards the resistance level of $22,000.
Bitcoin Prediction Statistics Data:
Bitcoin price now – $20,606
Bitcoin market cap – $398.3 billion
Bitcoin circulating supply – 19.0 million
Bitcoin total supply – 19.0 million
Bitcoin Coinmarketcap ranking – #1
BTC/USD Long-term Trend: Bearish (Daily Chart)
Key levels:
Resistance Levels: $28,000, $30,000, $32,000
Support Levels: $15,000, $13,000, $11,000
BTC/USD is currently trading at the $20,606 resistance level as the market price is crossing above the 9-day and 21-day moving averages, indicating a bullish movement since the beginning of today. For the past few days, the Bitcoin price has been preparing a move to the upside and in the context of the Bitcoin exchange rate forecast; an application of $21,000 resistance is expected.
Bitcoin Price Prediction: BTC May Hit the $22,000 Resistance
According to the daily chart, if the Bitcoin price stays and keeps moving above the 9-day and 21-day moving averages conveniently; it is likely for the king coin to touch the $21,000 level. This is where traders should expect buyers to fight for a further rise in BTC/USD and further development of the bullish trend. However, the purpose of this movement is to provide a level of resistance close to $22,000.
Looking at the market movement, there is likely that the Bitcoin price may experience a quick retracement or sell-off just in case it touches the crucial $22,000 level, but if not; traders may see additional resistance levels of $23,000 and $25,000. However, any further bullish movement could hit the resistance levels of $28,000, $30,000, and $32,000 respectively.
On the downside, if the price falls below the moving averages, BTC/USD could see a further decline towards the support levels of $15,000, $13,000, and $11,000. As revealed by the technical indicator, the market may gain more if the Relative Strength Index (14) crosses above the 40-level.
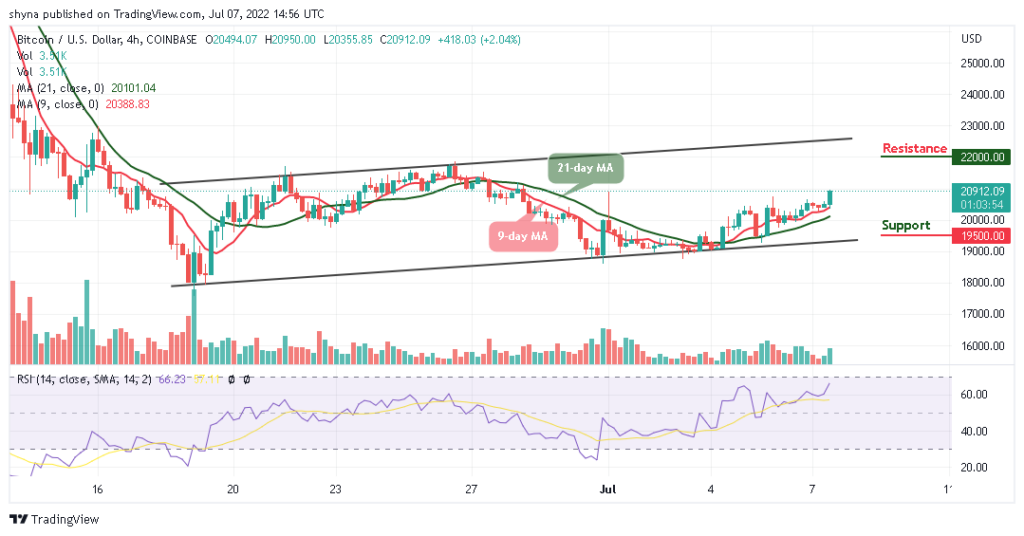
BTC/USD Medium-Term Trend: Ranging (4H Chart)
Looking at the 4-hour chart, the Bitcoin price is heading to the upside as the king coin remains above the 9-day and 21-day moving averages. On the contrary, if the selling pressure still exists, it could hold the coin not to follow the upward movement, and the $19,500 and below may come into play.
But, in as much as the buyers keep the price above the moving averages, traders may expect a strong bullish movement that could hit the resistance at $22,000 and above as the technical indicator Relative Strength Index (14) moves to cross into the overbought region, suggesting more bullish signals.
eToro – Our Recommended Bitcoin Platform
- Regulated by the FCA, ASIC and CySEC
- Buy Bitcoin with Bank transfer, Credit card, Neteller, Paypal, Skrill
- Free Demo Account, Social Trading Community – 20 Million Users
- Free Bitcoin Wallet – Unlosable Private Key
- Copytrade Winning Bitcoin Traders – 83.7% Average Yearly Profit
Read more: