

Bitcoin Price Prediction for Today, July 22: BTC Holds Over $22,500
Bitcoin Price Prediction – July 22
The business activity in the BTC/USD market holds over $22,500 in the following sessions. Price has been trading between the values of $22,815 and $23,602 at a positive percentage rate of 1.55. The last seven days’ low and high points are $20,518.90 and $24,196.82.
Bitcoin (BTC) Statistics:
BTC price now – $23,520.96
BTC market cap – $448.7 billion
BTC circulating supply – 19.1 million
BTC total supply – 19.1 million
Coinmarketcap ranking – #1
BTC/USD Market
Key Levels:
Resistance levels: $25,000, $27,500, $30,000
Support levels: $20,000, $17,500, $15,000
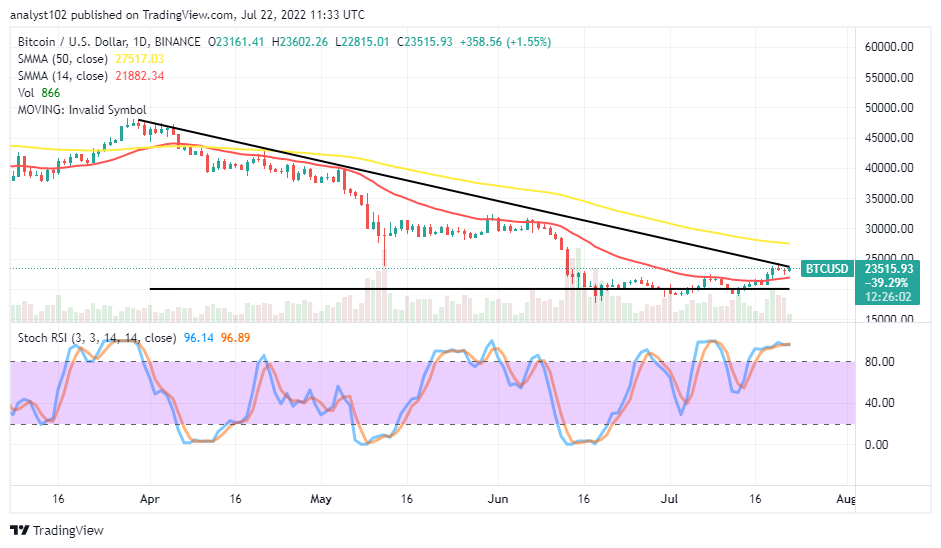
BTC/USD – Daily Chart
The daily chart showcases the crypto market holds over the $22,500 level around the bearish trend line above the smaller SMA trend line. The 14-day SMA indicator is underneath the 50-day SMA indicator. The horizontal line remains drawn at the $20,000 support level, closely below the value-line of the smaller SMA at $21.882. The Stochastic Oscillators are in the overbought region, with conjoined lines to signify a consolidation movement is ongoing somewhat.
Will the BTC/USD market surge higher?
Although, there has been a not significant signal to suggest the BTC/USD market operations will come down as the crypto market holds over the $22,500 level. Any attempt to surge higher past the value resistance level in the near time will lead price through variant resistances up to $27.517. Long-position placers may play along while the motion is at its early take-off. A formation of bearish candlestick spanning from around the resistance point may result in a real-time start for a necessary correction.
On the downside of the technical analysis, it is expected that the BTC/USD market bears to regain control of the operations. However, short-position takers should be wary of rallying movements that can occur from the current trading spot. A decent selling entry may emanate from around the trend line of the 50-day SMA. And the indicated value is around $27,517 in the long run.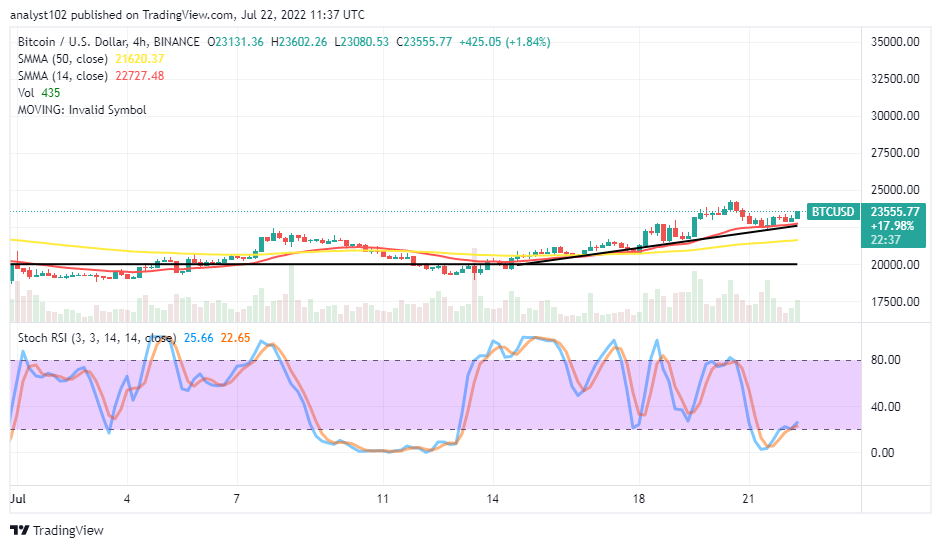
BTC/USD 4-hour Chart
The BTC/USD medium-term chart shows the crypto economy holds over $22,500 as it possesses a bullish trending outlook on the buying signal side of the smaller SMA. The 50-day SMA indicator has intercepted by the 14-day SMA indicator to the upside. The stochastic Oscillators are in the oversold region. And they are now trying to move northbound slightly above the 20 range. A smaller bullish candlestick is in the making to signify a buying moment prevails as of writing.
Battle Infinity – New Crypto Presale
- Presale Until October 2022 – 16500 BNB Hard Cap
- First Fantasy Sports Metaverse Game
- Play to Earn Utility – IBAT Token
- Powered By Unreal Engine
- CoinSniper Verified, Solid Proof Audited
- Roadmap & Whitepaper at battleinfinity.io
Read more: