
Bitcoin Price Prediction: BTC/USD Suffers a Sudden 2.33% Drop Towards $11,000
Bitcoin (BTC) Price Prediction – August 7
The Bitcoin price dropped from $11,917 to $11,346 in minutes but managed to recover.
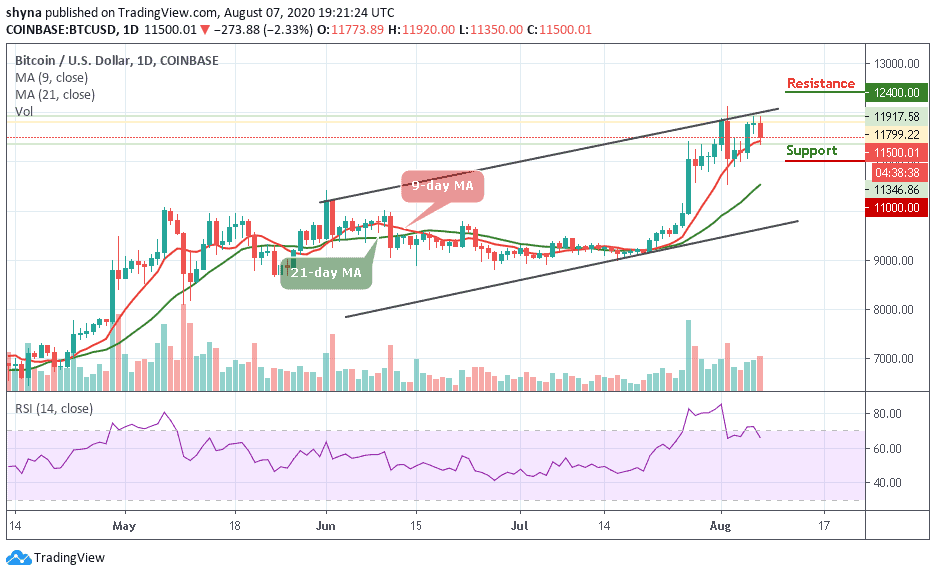
BTC/USD Long-term Trend: Bullish (Daily Chart)
Key levels:
Resistance Levels: $12,400, $12,600, $12,800
Support Levels: $11,000, $10,800, $10,600
At the time of writing, BTC/USD is trading down marginally at its current price of $11,500. This is around the price at which it has been trading throughout the past few days. BTC/USD falling below $11,500 and undergoing rejections at $12,000 is not positive for the bull case. Although the bulls have tried and failed on multiple separate occasions to gather enough buying pressure to break $12,000, each attempt has failed simultaneously.
What Is the Next Direction for Bitcoin?
Bitcoin is currently trading above the 9-day and 21-day moving averages at $11,500 after an attempt by the bears to take the price down to $11,000. The move happened in less than one hour after Bitcoin dropped below 9-day MA at $11,346 which is an important support level on the daily chart but the bulls managed to bounce back up from $11,346 to $11,500 where it is currently.
It is important to note that Bitcoin’s inability to post any sustained closes within the $11,800 region shows that it is currently plagued by underlying weakness. This consolidation phase has given rise to a plethora of bearish divergences that may cause the cryptocurrency to see a notable retrace in the days ahead.
Moreover, the potential resistance levels for the coin are located at $12,400, $12,600, and $12,800 while the critical supports lie at $11,000, $10,800, and $10,600 as the RSI (14) moves down from the overbought region, suggesting more bearish signals.
BTC/USD Medium-Term Trend: Ranging (4H Chart)
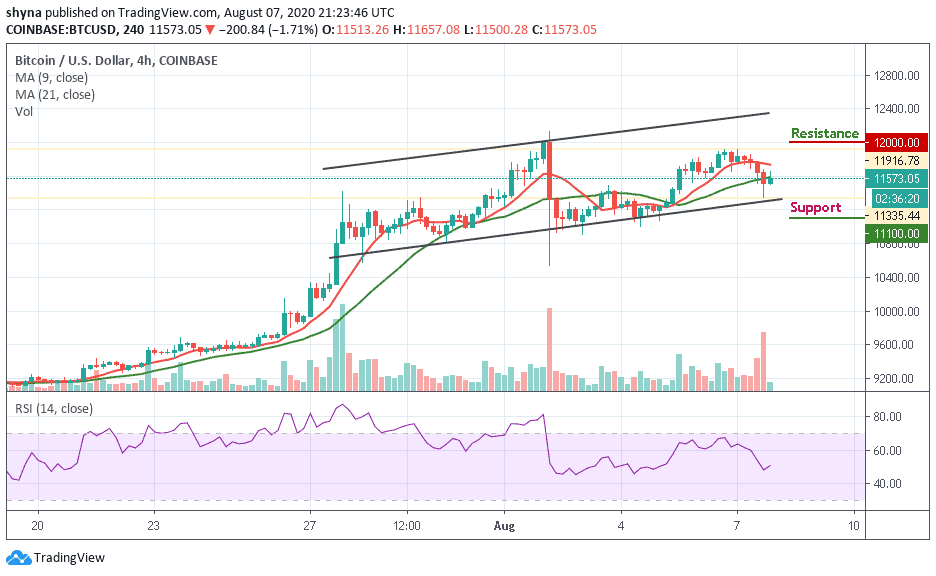
On the 4-Hour chart, on the downside, the immediate support is below the moving averages at $11,500 level. The price may likely fall below $11,300 if the bears fully stepped back into the market, a further movement could test the critical support at $11,100 level and below while the resistance is located above the moving averages at $12,000 and above. Technically, Bitcoin is currently moving in sideways while the RSI (14) moves around 51-level.